Predicting the course of a clinical trial is something which people will always want to do-whether for statistical reasons, planning reasons or business reasons. In this blog we look at examples of where prediction goes off course, and how we can resolve these issues. We also share valuable video and slidedeck resources from our VP Consulting and Software, Yannis Jemiai.
Predicting Enrollment and Events
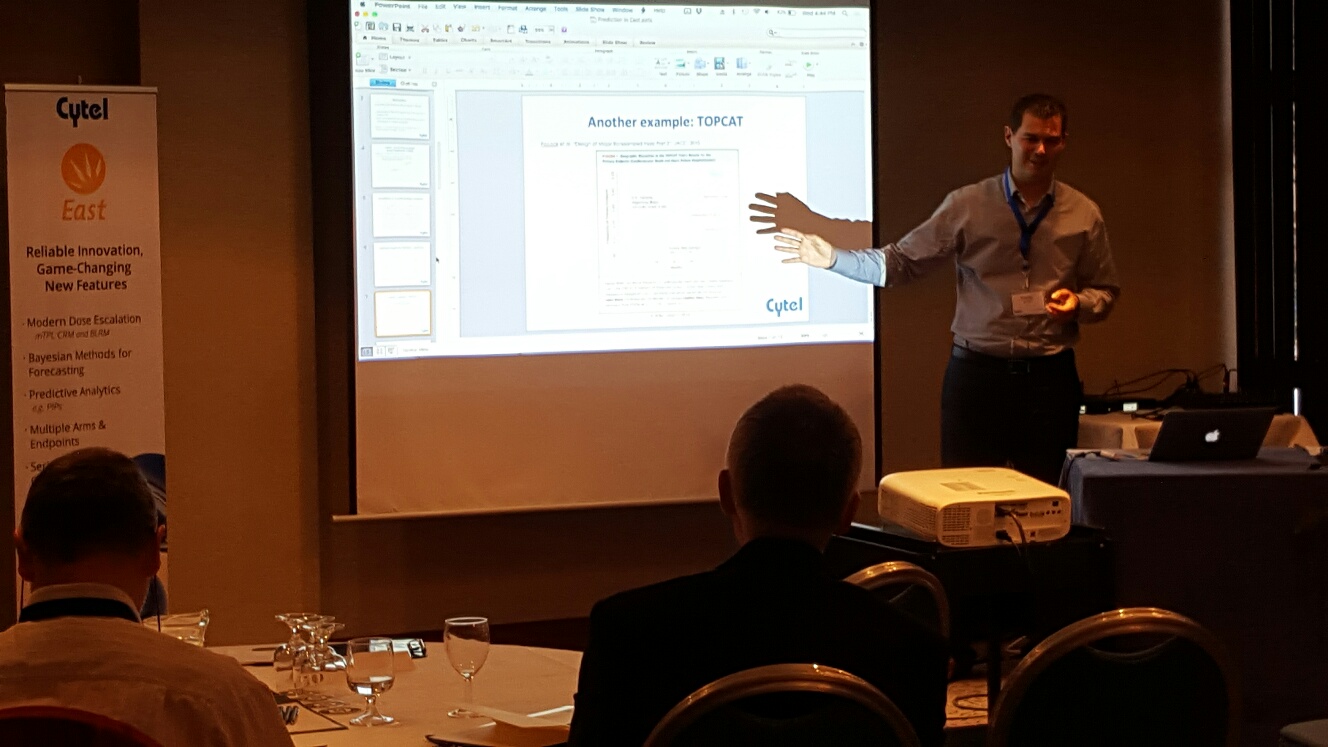
During the 2016 East User Group Meeting Yannis Jemiai outlined a motivating example for Cytel’s original development of EAST Predict which has now been upgraded in the latest release of East 6.4. The 
example was discussed by YL Pritchett in her presentation at JSM 2012 “Enrollment Speed, Data Heterogeneity, and Outcome of Adaptive Designs”. This presentation was made at a time when people were beginning to consider some of the operational hurdles of implementing adaptive designs.
The example was of a multi-look, Bayesian based trial with dropping arms. The study eventually stopped for futility. There were two important outcomes which inspired the Cytel software development team in their mission to address some of the challenges around enrolment and event prediction.
1) Enrollment in the study was faster than expected. For this trial, the projected enrolment speed was 20 patients a month and by the 3rd interim analysis it was predicted it would have enrolled 200 patients. However, by the time of this 3rd interim analysis when the trial stopped for futility they had in fact accrued all 260 patients. In summary, there were no savings in sample size. This highlights the importance of controlling enrolment speed. In an ideal situation ( Jemiai acknowledges this is not always easy to achieve) as a trial approaches the interim analysis accrual should slow.
2) Issues of data heterogeneity between countries. The data heterogeneity in the trial across participating regions were misleading at interim analyses- while data from the first enrolling countries showed improvement, the later enrolling countries did not show such an improvement. Jemiai also referred to Pocock et al. “Design of Major Randomized Trials: Part 3” JACC, 2015 which refers to similar geographic disparities encountered in the TOPCAT trial between the trial’s results for the primary endpoint across regions.
To avoid such outcomes it’s important to model recruitment not as a straight line but be able to specify information about countries and sites so allowing more granularity in the approach to modelling. East Predict allows this level of functionality and in the latest release East 6.4 now allows users to employ blinded data as well as unblinded data.
In the video of Jemiai's presentation he also discusses the use of Predictive Interval Plots ( PIPS) in East Predict . PIPs are a series of repeated confidence intervals generated by simulating the future course of the trial conditional on the current data. The intervals are sorted and stacked to provide an intuitive graphical display that facilitates early termination decisions by DMCs.
To download Yannis' slides click below.

Further reading
Blog: East 6.4 Release
Blog: Dual Agent Dose Escalation Designs
Blog: East to take on multi arm multi stage designs
Blog: Pocock, S., Clayton, T. and Stone, G. (2015) ‘Design of Major Randomized trials: Part 3 of a 4-Part series on statistics for clinical trials’, Journal of the American College of Cardiology., 66(24), pp. 2757–66.


